Supplementary material for Predicting laughter track for Sitcoms: A Vision and Text based Approach
Anonymous WACV'21 Submission
-
Demo Video
-
The source code of one of our models as an example code
-
An example subset of our text dataset consisting of randomly sampled 400 dialogues
-
Additional Plots/Figures
tSNE plots of Visual Dialogs 
A tSNE plot made by randomly selecting 1500 images (each from Humorous and Non-Humorous set) as the last frame of some visual dialog turns. Sometimes these visual models could cheat by detecting some pattern inHumorous/Non-Humorous visual dialogs like specific camera angle etc. The above plot hints towards its absence.To visualize the plot better, each image is represented by a dot and the corresponding plot is shown below. (Currentplot is slightly scaled up to ease the visibility.) 
A green dot represents a humorous sample and red dot, a non-humorous sample. They seem to be randomly distributed, hinting towards absence of any such bias.
Bar plots drawn for the word distribution of dialogs spoken by Top 6 Speakers in our dataset. Similarity in the top 20 set of each plot suggests that humor/non-humor is not biased due to a particular speaker. 


Other Dataset Statistics 


The figure showing average time per turn in a Dialog, across the Dataset. The figure showing average dialog time, across the Dataset. The figure showing contribution of each speaker in generating humor, across the Dataset.
MSAM model
The figure describing the proposed Multimodal Self Attention Model (MSAM) for the laughter detection task. We obtain features of each joint dialogue turn using Multimodal Self attention network. We then obtain the final feature vector using a sequential network before feeding the resultant vector to the binary classifier. 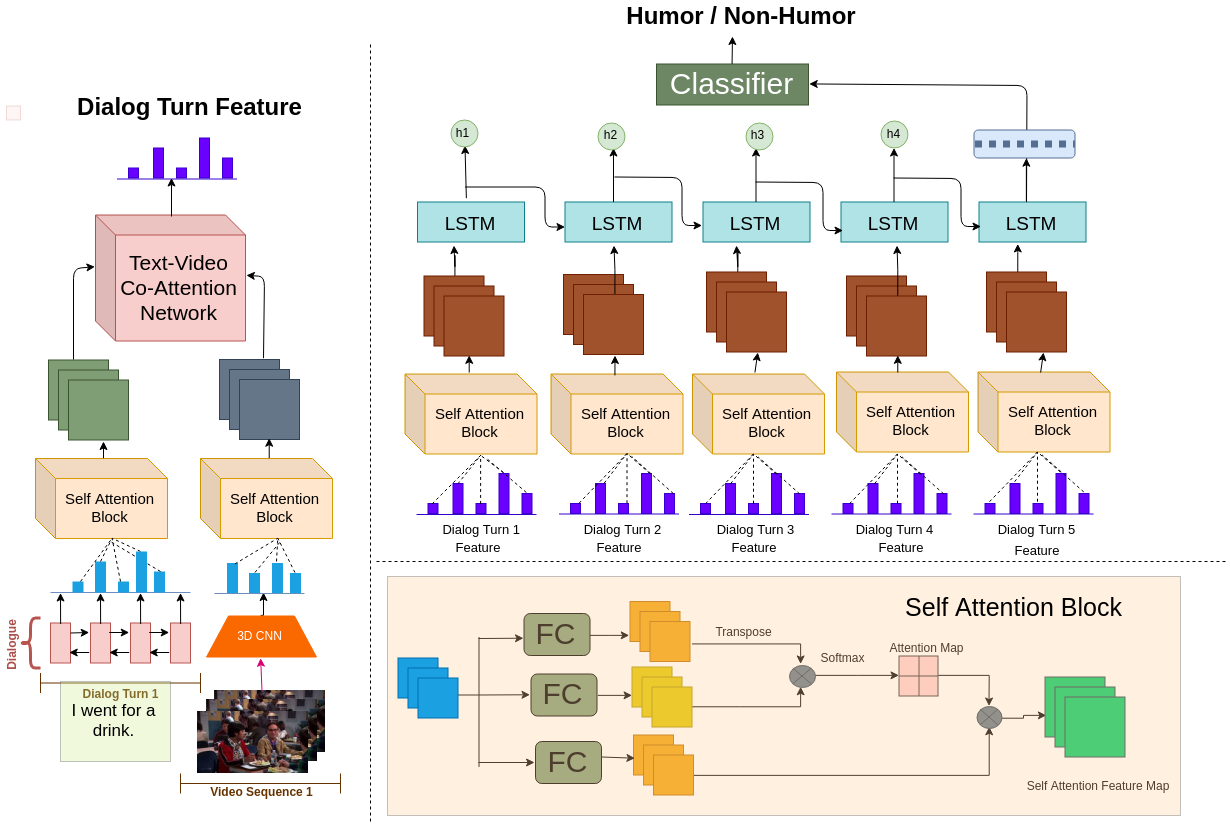
Qualitative results
Randomly sampled results (MSAM model) of each prediction category, (correct/incorrect) x (humor/non-humor). Eg. Humor label in a red box means ground truth label was non-humor but predicted label was humor. 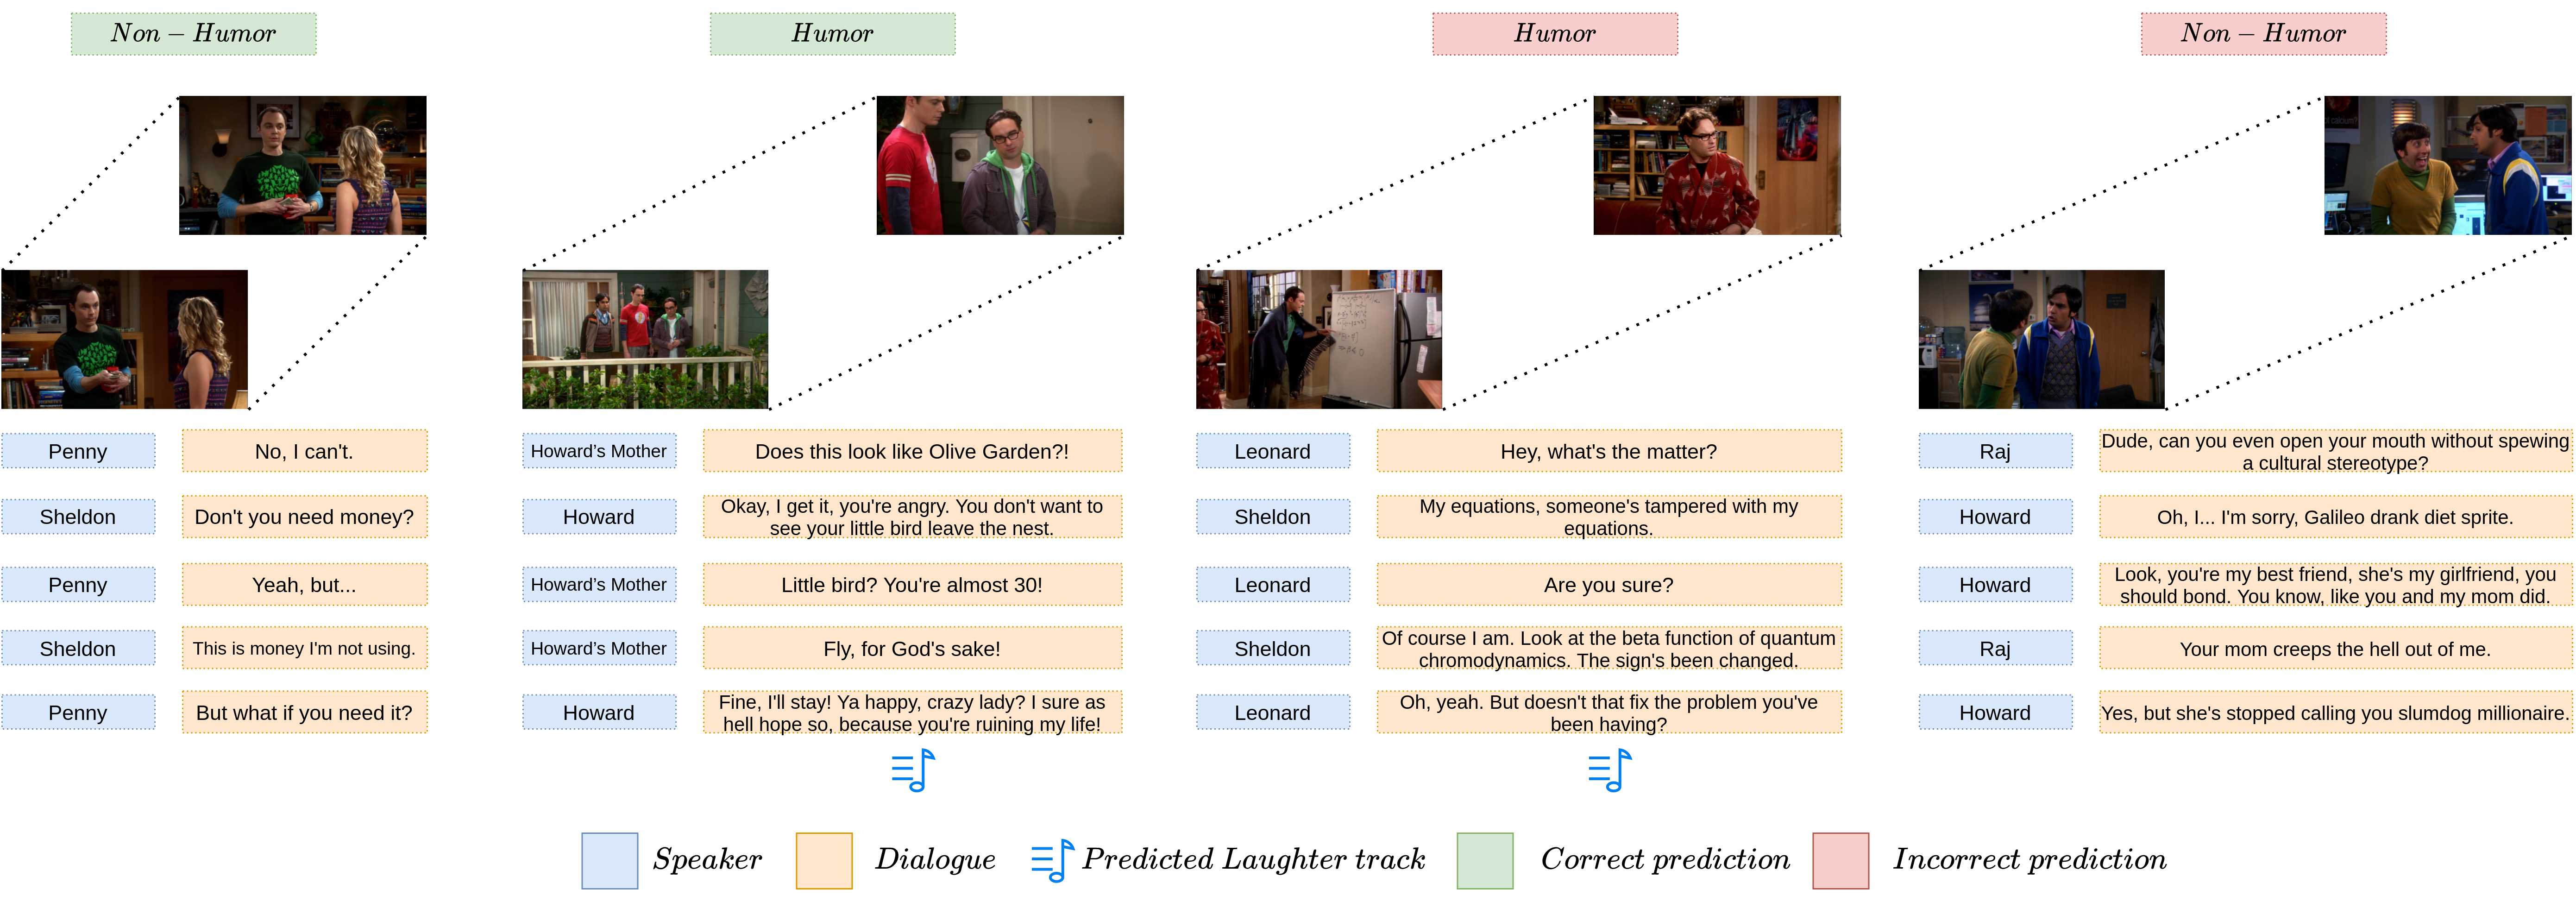
Explaining humor
The left column shows visualization of attention at the word level and the right column shows attention visualization at turn level. 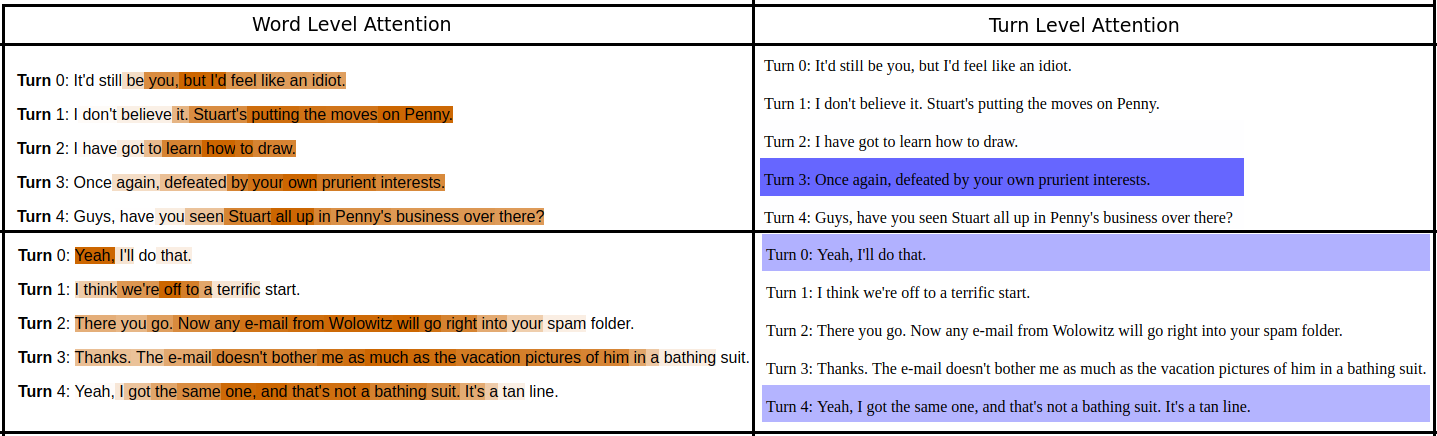
Baseline Models
Fusion Models 

Text based Fusion Model (TFM) Video based Fusion Model (VFM) Attention Models 

Text based Attention Model (TAM) Video based Attention Model (VAM)